Many researchers face challenges with computational reproducibility. For instance, running analysis code written just a year earlier can be problematic. Even if it worked flawlessly and gave the expected results earlier, it might fail due to errors now (see Fig. 1). These issues are typically due to the use of newer versions of analysis software…. Read More
Increasing the Lifespan of Software for Demographic Analysis
![Figure 1. Reproducibility struggles. Left: Three laptops showing different software configurations, symbolizing challenges in reproducing results. Right: A single laptop displaying multiple virtual containers with distinct software setups, highlighting improved reproducibility.](https://population-dynamics-lab.csde.washington.edu/wp-content/uploads/2024/04/fig_01_error_v_container-1200x600.png)
Expanding the Lifespan of Software for Demographic Analysis with Containers: An Application of Spatial Sampling
![Figure 1. Reproducibility struggles. Left: Three laptops showing different software configurations, symbolizing challenges in reproducing results. Right: A single laptop displaying multiple virtual containers with distinct software setups, highlighting improved reproducibility.](https://population-dynamics-lab.csde.washington.edu/wp-content/uploads/2024/04/fig_01_error_v_container-1200x600.png)
Introduction Software, such as specific R packages, evolve over time, which may prevent older analysis code from working as expected. For example, default values for arguments in a function can change. Therefore, for computational reproducibility, knowing which specific R and package versions were used to run the analysis is crucial. One popular solution in R… Read More
Unlocking Population Estimation Using Readily Available Data: Applying the Simplified Censal Ratio Method
![Figure 2: Figure 2 shows a graph depicting the correlation between the Censal Ratio Population estimate of 2019 (based on 2010 data) and the actual US Census Bureau’s 2019 population estimate of 2019. The x-axis shows a range of the 2019 censal ratio population estimate, ranging from 0 to 800,000. The y-axis shows a range of the 2019 population estimate and also ranges from 0 to 800,000. The graph demonstrates how the Censal Ratio Method produces a more closely accurate set of estimations than the symptomatic indicator alone.](https://population-dynamics-lab.csde.washington.edu/wp-content/uploads/2024/04/censal_ratio_to_pop_plot-1200x1047.png)
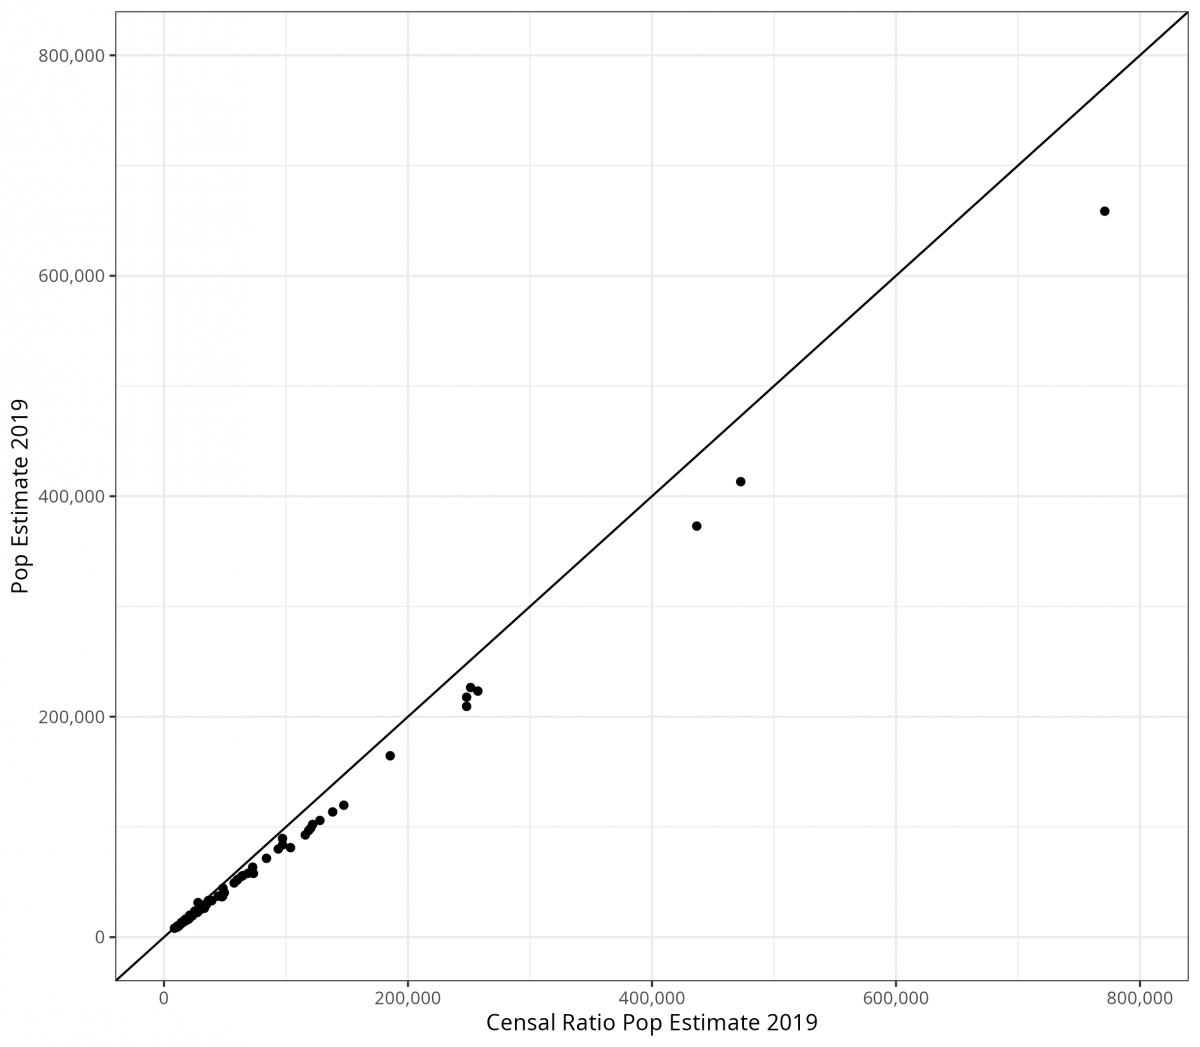
Population estimation is generally a straightforward process: any population must result from a past population number plus the births minus the deaths plus the net migration. This cohort-component method is often considered the ‘gold standard’ for population estimation (Gerland, 2014). However, the components of change (births, deaths, migrants) used to forecast a future population are… Read More