

Introduction
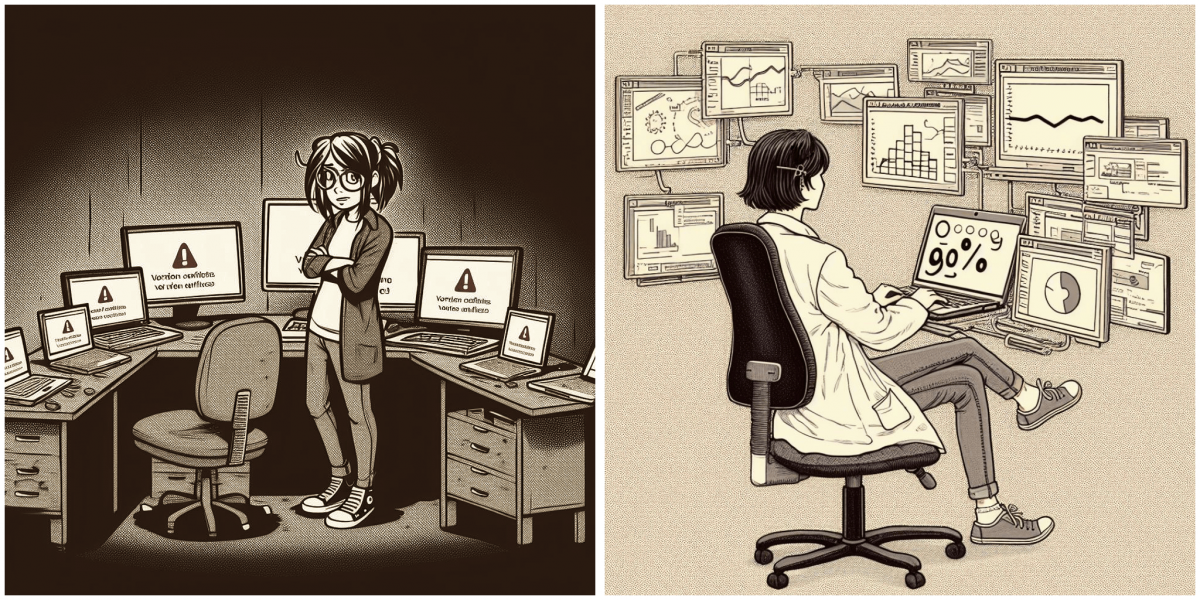
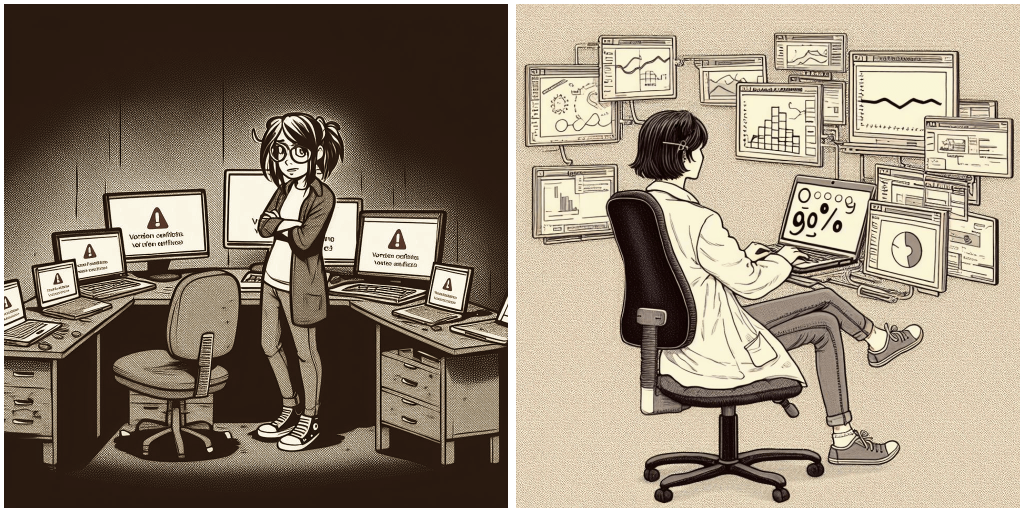
Software, such as specific R packages, evolve over time, which may prevent older analysis code from working as expected. For example, default values for arguments in a function can change. Therefore, for computational reproducibility, knowing which specific R and package versions were used to run the analysis is crucial. One popular solution in R is to use the sessionInfo() command to note down the R and package versions. However, a package may be removed from the official R repository (CRAN) altogether. For example, the package “MortalitySmooth” was removed from CRAN in 2020, and the popular spatial analysis packages “rgdal”, “rgeos”, and “maptools” were retired in October 2023 (Nowosad, 2023). As a consequence of that, many other dependent packages might have also been removed. Installing a deprecated R package is complicated, and running older R code will become more difficult and time-consuming. A practical solution to maintain reproducibility despite constantly changing software is using containers. Containers provide stable and consistent computational environments (see Figure 1).
This note aims to (i) introduce containers to the demographic community, (ii) demonstrate their use with deprecated R packages, and (iii) to spark a discussion on computational reproducibility in the demographic community.
What are containers? Why use them?
A container is a file that, similarly to a zip archive, contains other files. Specifically, it includes minimal operating system components and any other software of one’s choice, including R, Python, and most other scientific software.
Unlike a zip archive, a container does not need to be unpacked to run the software. Hence, there is no waiting time to unpack or install specific software versions to work on a particular project. From within a container, R starts almost instantly, as if installed on a physical computer, and runs the analysis just as fast.
Any R and RStudio versions can be launched directly from a container on any computer. Any software inside a container is completely independent of the physical computer. Hence, an R version that might already be installed on the physical computer will never conflict with R inside the container.
Software from within a container can run on any popular operating system. Even though R will be running under Linux inside a container, it can be launched on Windows and macOS. One needs to install just one piece of container-running software (discussed in the next section) on their physical computer to independently run any number of different R versions from containers. Furthermore, collaborators can share containers so collaborators can run the same R and package versions without installing those on their physical computers.
Finally, publishing containers along with the analysis code is a good way to make it easier for the reviewers and other researchers to inspect and reproduce submitted work. This approach significantly reduces the barriers to scientific progress, eliminating the need for time-consuming setup processes and troubleshooting software incompatibilities.
How to use containers? What options are out there?
There are different ways to run containers, but all available approaches are conceptually similar. Essentially, one needs a container with the required versions of R, RStudio and packages and a container-running software installed on a physical computer or in the cloud.
The most popular software for creating, managing, and running containers is Docker (available for Windows, macOS, and Linux). Alternatively, there is Apptainer (previously known as Singularity) for Linux. However, both require installation on a physical computer and at least minimal skills with the terminal.
The Binder project provides an approachable way to get started with containers online without installing any software on the local computer. This free website allows one to run code in a container on a temporary cloud server with up to 1-2 GB of operating memory in a web browser for up to 6 hours at a time. After 6 hours, the container can be restarted to continue working. This is not enough for serious work, but enough to get familiar with the containerization technology and see its benefits firsthand. Due to this limitation, there are two primary use cases for Binder:
(1) to make the final steps of a reproducible analysis available for inspection and execution by anyone. The “Launch in Binder” button can often be found in GitHub repositories with so-called “reproducible research compendiums”: analysis code published alongside academic papers (some examples can be found here: 1, 2, 3). Typically, the code published this way produces only the final plots for the paper due to the memory, computational power, and time limits of mybinder.org. However, the complete, more resource-demanding analysis can still be fully reproducible with the same container and container software installed on a local computer.
(2) to run some short, lightweight analyses for free. This is useful for self-education, experiments with containers, and tutorials for classes one might be teaching.
Running an analysis at mybinder.org requires just three steps. First, upload the analysis code and data to a GitHub repository (or a similar code storage website). Second, along with the code, upload a short plain text configuration file for mybinder.org with instructions on which container to use (see the The Download and GitHub repository accompanying this note). Finally, paste the link to the GitHub repository at https://mybinder.org/ or create a “Launch Binder” button in the repository for anyone to run a container with the analysis code in a single click.
Whenever someone clicks the “Launch Binder” button in the repository, mybinder.org will download the code and instructions from the repository and build and run a container in the cloud. In a few moments, the user can inspect and run the published code in a familiar RStudio interface as if it were running on their computer (see Fig. 2).
Where to get containers, and how to create your own?
For most applications, relying on one of the ready-to-use containers with pre-installed analysis software will be enough. For example, The Rocker Project provides various types of containers: basic installation of command-line R, R with RStudio, R with RStudio and Tidyverse packages, the same with geospatial packages, etc. Each container is versioned, meaning a user can request a specific R version. The pre-installed packages in a Rocker container will match this R version by release date. Additional packages not included in Rocker’s standard containers can be installed by specifying them in a configuration file or an R script and these will also be installed from a CRAN snapshot available at the time of selected R release. If required, specific package versions can be installed inside the container using a package manager such as renv or pacman. Another project, similar to The Rocker Project, is r-minimal which is maintained by the R Consortium. Alternatively, custom containers with any operating system and software can be created manually from scratch. However, this is an advanced topic that will not be covered here.
To customize one of the pre-built containers for their own purposes (mostly by installing additional packages), the user must create two simple plain text files. These will be the same for local and cloud use, as demonstrated in the example below. Everything else will be handled by the container-running software.
Live demo
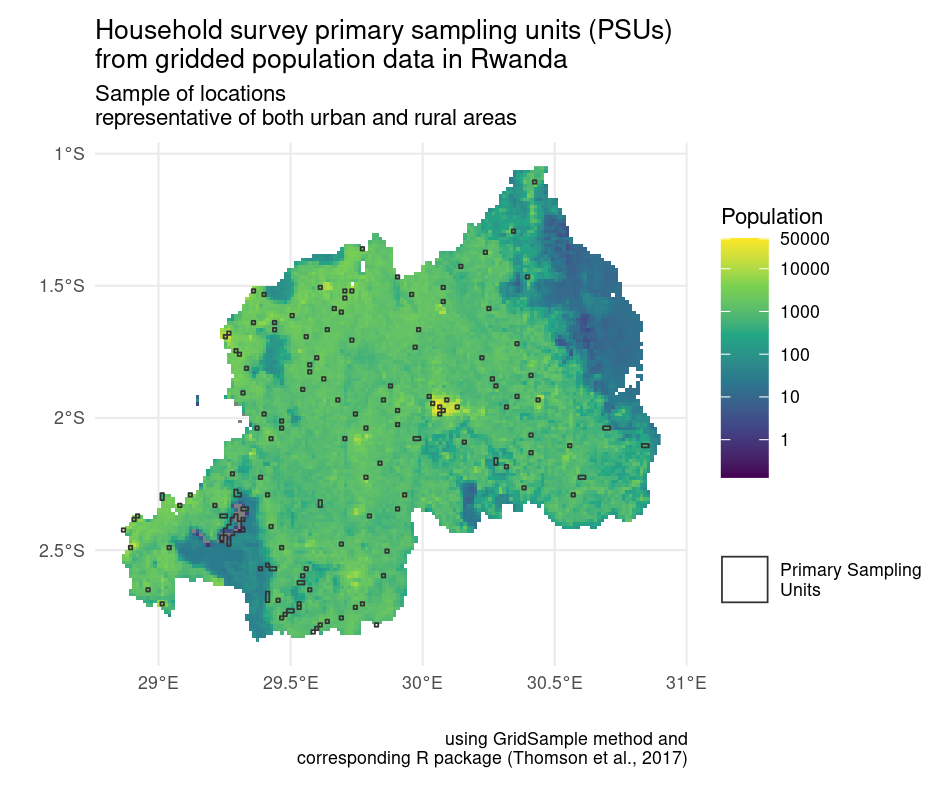
In our example, we focus on the R package GridSample (Thomson et al., 2017) to recreate primary sampling units with balanced urban and rural locations (see Fig. 3). GridSample was removed from CRAN, thus making its functions unavailable to most researchers. We solve this with a container.
We created a minimal set of files to create and run GridSample from a container in the repository https://github.com/Population-Dynamics-Lab/grid-sample-containerized. We use just 4 lines of code to create a container with R version 4.0.1 released in 2020, the relevant version of RStudio, GridSample and its dependencies. Three of those lines are in a plain text file named Dockerfile. The lines (1) describe which container to use–we use rocker/binder that has the most R packages and is designed to work well with mybinder.org; (2) instruct the container running software to copy all files from the repository inside the container so that a user can run the analysis; and (3) specify an R script file for package installation. The final fourth line of code is in the R script install.R. It provides an R command to install the GridSample package, which is not included in the standard Rocker container. A main.Rmd file contains analysis adapted from the GridSample R package vignette (Thomson et al., 2018) that the user can run after the container is started and RStudio is loaded (see Fig. 2). Finally, a README.md contains a plain text commentary and code to create the “Launch Binder” button to start the container.
All lines in the text files in our example repository are extensively commented to provide context and the meaning of each command. Using this repository as a template, one can create their own reproducible environments with any version of R running in the cloud using https://mybinder.org/.
Citations
Bibliography
Nowosad, J. (2023). Upcoming changes to popular R packages for spatial data: What you need to do. https://geocompx.org/post/2023/rgdal-retirement
Thomson, D. R., Stevens, F. R., Ruktanonchai, N. W., Tatem, A. J., & Castro, M. C. (2017). GridSample: An R package to generate household survey primary sampling units (PSUs) from gridded population data. International Journal of Health Geographics, 16(1), 25. https://doi.org/10.1186/s12942-017-0098-4
Thomson, D. R., Stevens, F. R., Castro, M. C., & Tatem, A. J. (2018). GridSample: Tools for Grid-Based Survey Sampling Design. R package version 0.2.2. https://CRAN.R-project.org/package=gridsample
WorldPop. (2020). Global 100m Population total adjusted to match the corresponding UNPD estimate. Rwanda, 2010. https://hub.worldpop.org/geodata/summary?id=28462 , https://doi.org/10.5258/SOTON/WP00660
Computation & Reproducibility
All code necessary to implement the methods and reproduce the figures and results in Expanding the Lifespan of Software for Demographic Analysis with Containers: An Application of Spatial Sampling has been archived as of publication on April 17, 2024 by the Population Dynamics Lab here: UW PopLab Github.
Suggested Citations
and (2024). Expanding the Lifespan of Software for Demographic Analysis with Containers: An Application of Spatial Sampling. The Denominator, Population Dynamics Lab. https://doi.org/10.6069/WY8K-D973 [Accessed July 27, 2024].
and (2024). Expanding the Lifespan of Software for Demographic Analysis with Containers: An Application of Spatial Sampling: Computation Supplement. The Denominator, Population Dynamics Lab. https://github.com/Population-Dynamics-Lab/grid-sample-containerized [Accessed July 27, 2024].
[DOI Link:] https://doi.org/10.6069/WY8K-D973