Many researchers face challenges with computational reproducibility. For instance, running analysis code written just a year earlier can be problematic. Even if it worked flawlessly and gave the expected results earlier, it might fail due to errors now (see Fig. 1). These issues are typically due to the use of newer versions of analysis software…. Read More
Increasing the Lifespan of Software for Demographic Analysis
![Figure 1. Reproducibility struggles. Left: Three laptops showing different software configurations, symbolizing challenges in reproducing results. Right: A single laptop displaying multiple virtual containers with distinct software setups, highlighting improved reproducibility.](https://population-dynamics-lab.csde.washington.edu/wp-content/uploads/2024/04/fig_01_error_v_container-1200x600.png)
Unlocking Population Estimation Using Readily Available Data
![Figure 2: Figure 2 shows a graph depicting the correlation between the Censal Ratio Population estimate of 2019 (based on 2010 data) and the actual US Census Bureau’s 2019 population estimate of 2019. The x-axis shows a range of the 2019 censal ratio population estimate, ranging from 0 to 800,000. The y-axis shows a range of the 2019 population estimate and also ranges from 0 to 800,000. The graph demonstrates how the Censal Ratio Method produces a more closely accurate set of estimations than the symptomatic indicator alone.](https://population-dynamics-lab.csde.washington.edu/wp-content/uploads/2024/04/censal_ratio_to_pop_plot-1200x1047.png)
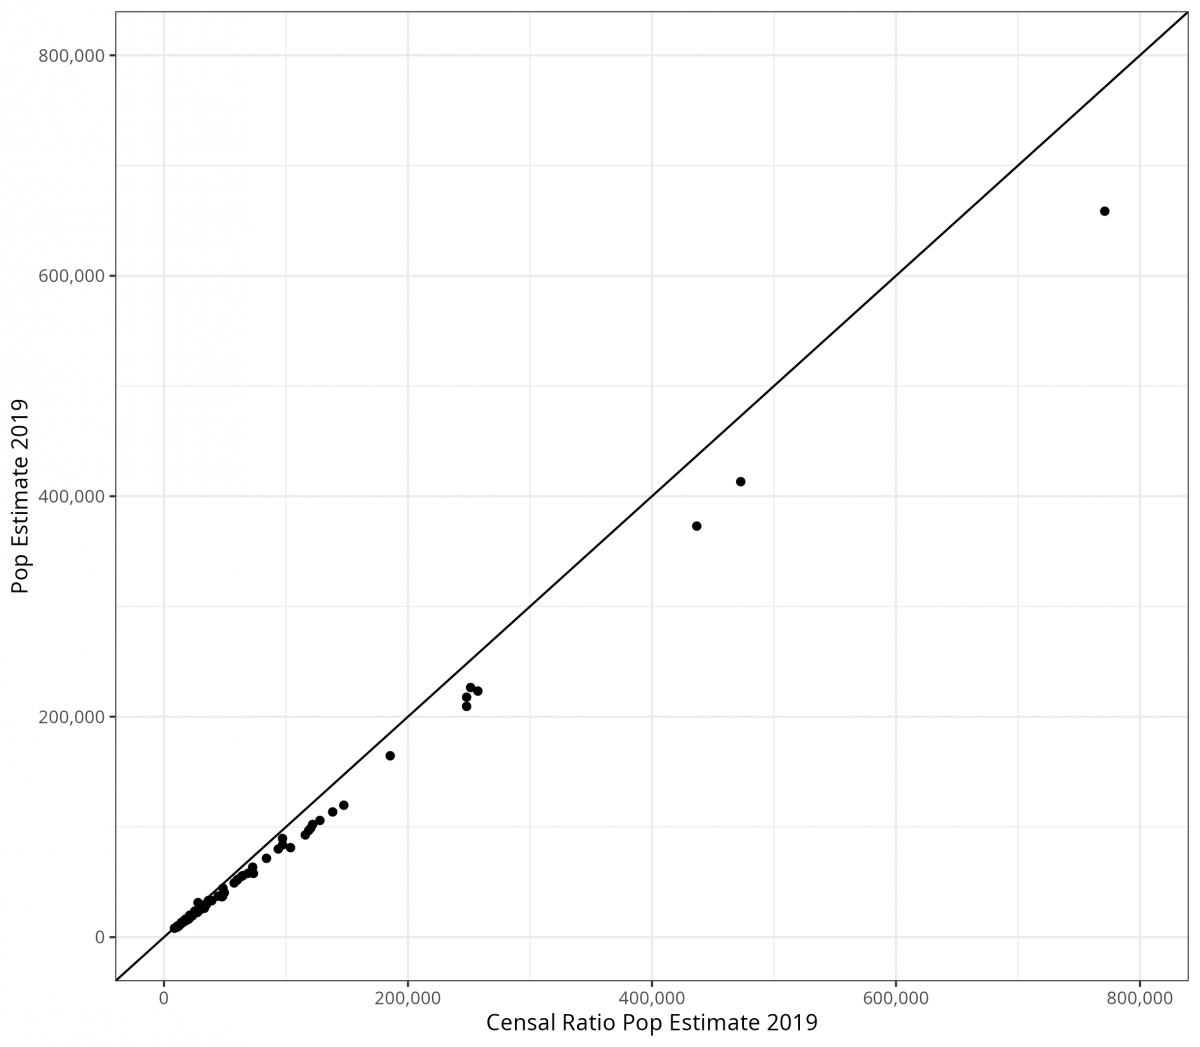
Population estimation techniques rely on past population data, number of births, deaths, and migration. While various techniques have been used to accurately produce population estimates, the gold standard has been the cohort-component method. However, this method is limited by the fact that some populations may lack the appropriate indicators (e.g., births, deaths, or other changes… Read More
Knowing and understanding change: Methods insights using historical pandemic data
![Two plots of mortality rates for six major causes of death in the United States from 1900-1998: accidents, cancer, heart disease, influenza and pneumonia, stroke, and tuberculosis. The left image is age-adjusted mortality rates for the time period, showing a notable large increase and then decrease of heart disease and other various trends for the other causes. The right image is the log transformations of these mortality rates, showing a notable dramatic decrease in tuberculosis mortality, specifically.](https://population-dynamics-lab.csde.washington.edu/wp-content/uploads/2022/10/TVD_plot1-1200x800.png)
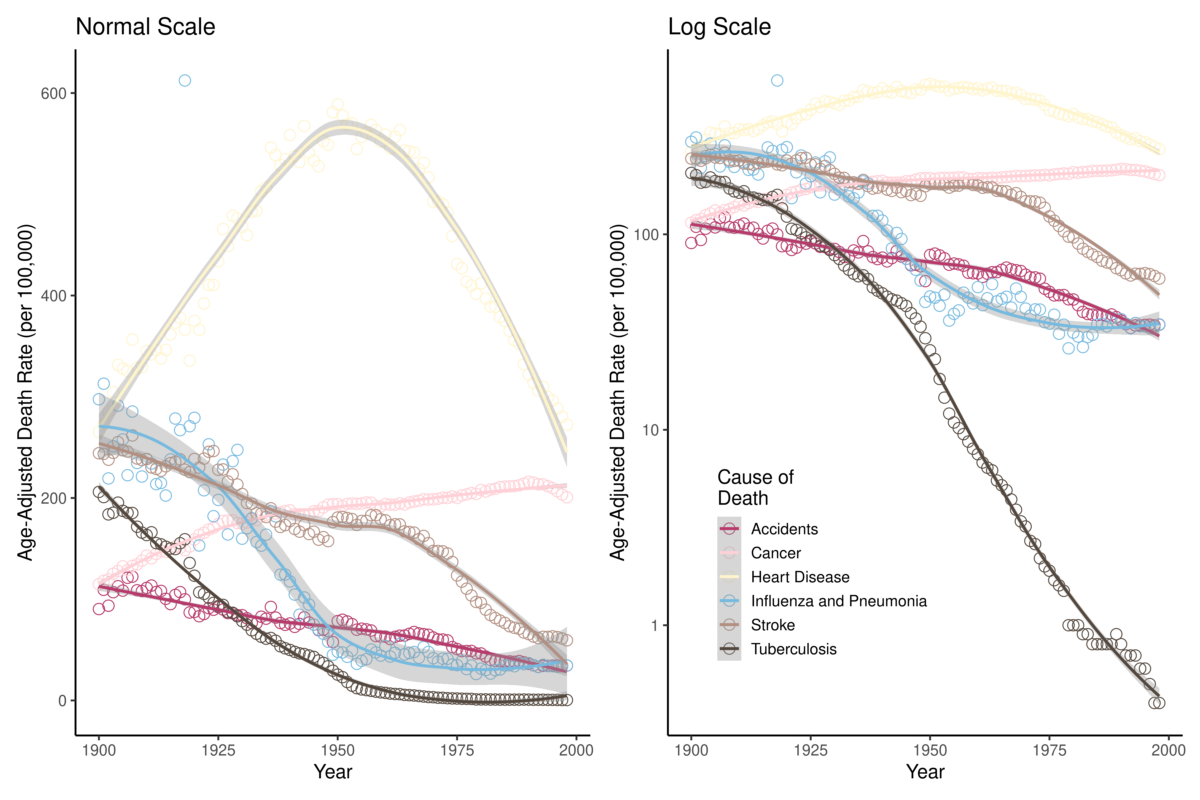
Pandemic diseases, like COVID-19, have far-reaching effects that are difficult to identify or predict during the course of the pandemic itself. Case numbers and mortality due to pandemic diseases ebb and flow, but even after time has passed, it is useful to know (1) when the waves occurred, (2) if the pandemic disease had effects… Read More