
Population estimation is generally a straightforward process: any population must result from a past population number plus the births minus the deaths plus the net migration. This cohort-component method is often considered the ‘gold standard’ for population estimation (Gerland, 2014). However, the components of change (births, deaths, migrants) used to forecast a future population are not readily available for timely forecasts. This is especially true when forecasting needs are for small geographies, sub populations, or high frequency and short time intervals.
In these cases, indirect population estimation methods do exist as alternatives for producing population estimates in situations when a traditional cohort-component method cannot be readily deployed. One particularly useful method is the Censal Ratio Method (Bogue, 1950) which has both a straight-forward interpretation and requires very little data. The method assumes that population change between two periods occurs in the same ratio as a given symptomatic indicator. Symptomatic indicators can encompass a wide range of data, such as vital event registrations, school enrollments, voter registrations, driver’s licenses, electrical usage, and more. This diversity of potential indicators makes the Censal Ratio Method appealing, especially in situations where the more data-intensive Cohort-Component method is not feasible. The effectiveness of this method is directly proportional to how closely the symptomatic indicator aligns with the population being estimated.
Oftentimes a symptomatic indicator is used at face value to estimate a population when it might seem most closely correlated with population totals. For example, announced attendance for a sporting event could be closely correlated with the daytime population during that sporting event. Or, the net difference between in-bound and out-bound flight passengers might be most closely correlated with net migration. Or, the number of social media users in a given area might be closely correlated with the population total of that area. However, symptomatic indicators rarely perfectly correlate with population values and using the symptomatic indicator alone can lead to erroneous estimation. Further refinements of the Censal Ratio Method do exist that seek to better account for these uncertainties and the possibilities of error, including regression-based approaches (Bryan 2004) and the inclusion of uncertainty (Swanson et al. 2012).
In its simplest form, the model is mathematically expressed as follows:
(1) 
where  is a given symptomatic indicator at time
  .
.  is simply the ratio,
  , of the symptomatic indicator to the population. This equation can also be written as
(2) 
Consider the following example using voter registration data for Alabama counties. Using voter registration data in 2010 and 2019, we could estimate the 2019 population in Alabama Counties using only population data for 2010, assuming that the relationship between voter registration and total population is the same in both 2010 and 2019. For example, Autauga County, Alabama, had 33,885 registered votes in 2010, a County population total of 54,773 at Census 2010, and 39,986 registered voters in 2019. Assuming the relationship between registered voters and total population remained unchanged in 2019 compared to 2010, the Censal Ratio Method would estimate Autauga’s 2019 population as 64,635.
In the model, we have:
(3) 
and
(4) 
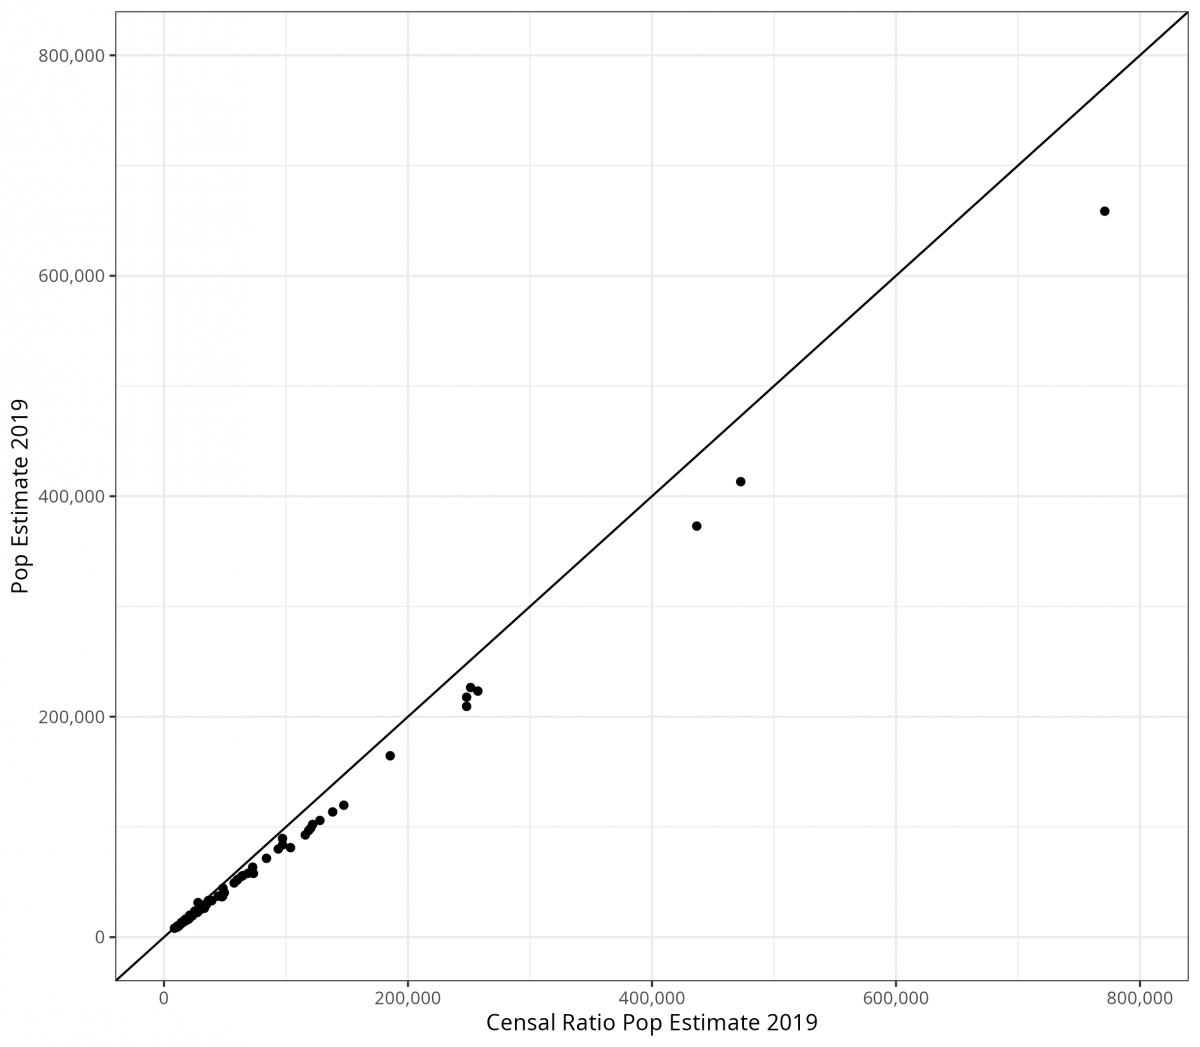
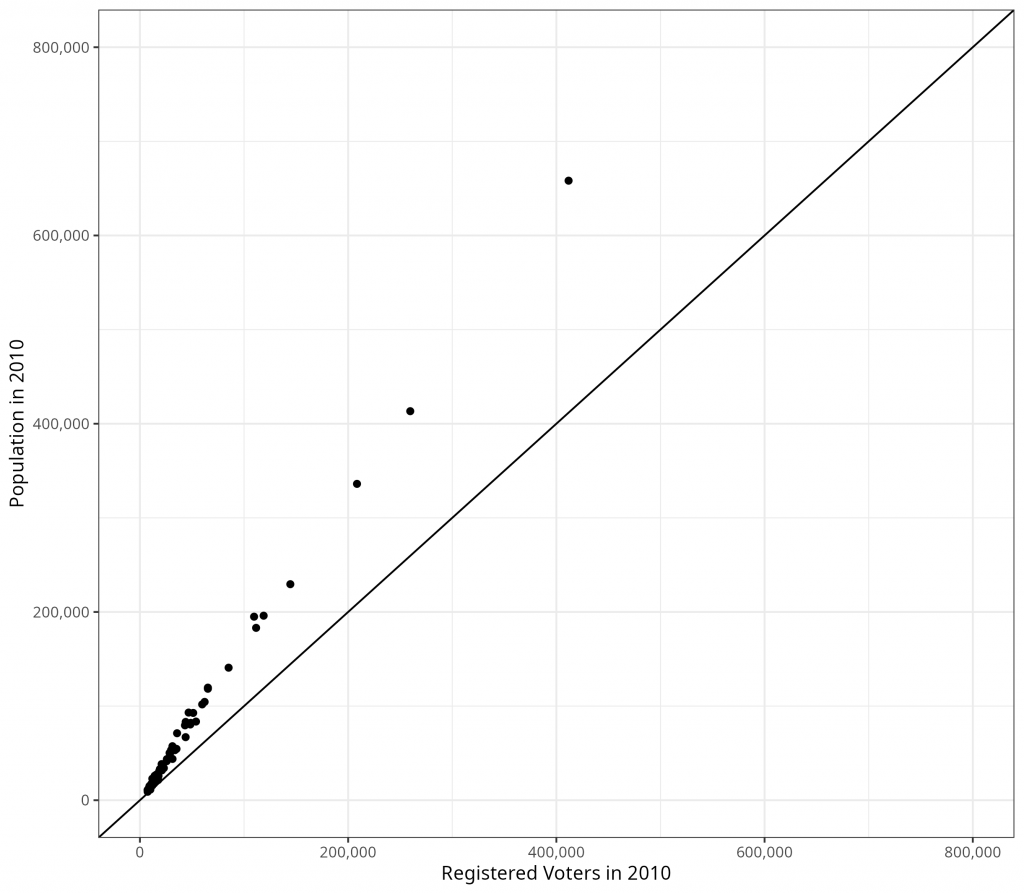
Figures 1 and 2 show the value of the application of the Censal Ratio Method in all Alabama Counties, highlighting how one cannot just use the symptomatic indicator as a mere substitute (Figure 1) and instead use the ratio to more closely estimate the population. While Figure 1 demonstrates a close correlation between voter registration and county populations in Alabama, it is evident that relying solely on voter registration would result in an underestimation of Alabama county populations.
By contrast, Figure 2, which incorporates the ratio of voter registration to the total population (as observed in 2010), significantly improves the accuracy of our population estimates using the Censal Ratio Method. In Figure 2, the x-axis displays the results from the Censal Ratio Method incorporating the 2010 ratio between voter registration and population to generate a population estimate for 2019. This value is compared to the U.S. Census Bureau’s 2019 population estimate on the y-axis.
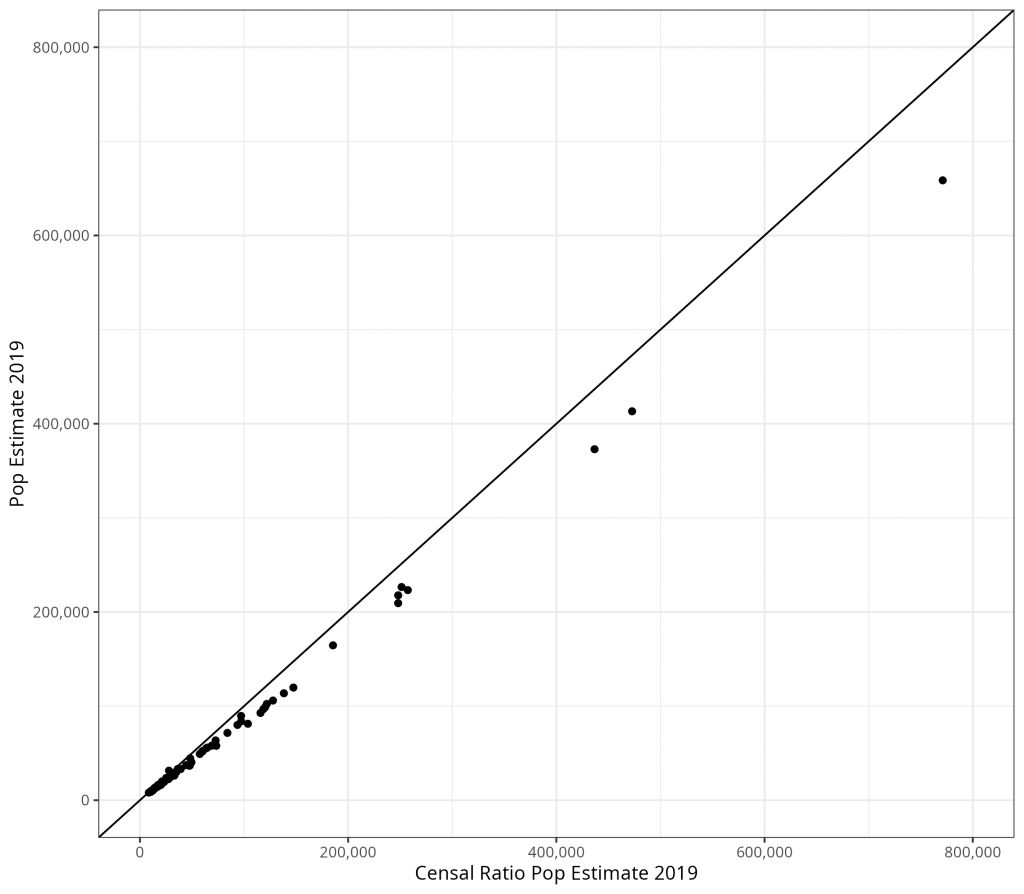
In comparing Figure 1 and Figure 2, the Censal Ratio method performs well, relative to merely using a symptomatic indicator. In particular, the direct correlation approach shows a quickly growing gap as the size of the population grows. This gap is much smaller for a larger array of population sizes when using the Censal Ratio Method. The correlation hews closely to a perfect correlation for the most part, except for a few outlying and large counties. The Censal Ratio Method is therefore a simple, useful, intuitive, and easily reproducible approach to estimating populations when a Cohort-Component approach is not feasible.
Citations
Bogue, D. J. (1950). A technique for making extensive population estimates. Journal of the American Statistical Association, 45(250), 149–163.
Bryan, T. (2004). Population estimates. In J.S. Siegel & D. A. Swanson (Eds.), The Methods and Materials of Demography, 2nd edition (pp. 523–560). San Diego, US: Elsevier.
Gerland, P. (2014). UN Population Division’s Methodology in Preparing Base Population for Projections: Case Study for India. Asian Population Studies, 10(3), 274–303.
Smith, S. K., Tayman, J., Swanson, D. A. (2013). Implementing the Cohort-Component Method. In, A Practitioner’s Guide to State and Local Population Projections (pp. 155-183). Dordrecht, NL: Springer.
Swanson, D. A., Tayman, J. (2012). Censal-Ratio Methods. In: Subnational Population Estimates (pp. 187–194). Dordrecht, NL: Springer.
Computation & Reproducibility
All code necessary to implement the methods and reproduce the figures and results in Unlocking Population Estimation Using Readily Available Data: Applying the Simplified Censal Ratio Method has been archived as of publication on April 17, 2024 by the Population Dynamics Lab here: UW PopLab Github.
Suggested Citations
(2024). Unlocking Population Estimation Using Readily Available Data: Applying the Simplified Censal Ratio Method. The Denominator, Population Dynamics Lab. https://doi.org/10.6069/BVPC-4381 [Accessed July 27, 2024].
and (2024). Unlocking Population Estimation Using Readily Available Data: Applying the Simplified Censal Ratio Method: Computation Supplement. The Denominator, Population Dynamics Lab. https://github.com/Population-Dynamics-Lab/censal_ratio_method [Accessed July 27, 2024].
[DOI Link:] https://doi.org/10.6069/BVPC-4381